PySurv


PySurv is a Python package for generating and plotting Kaplan-Meier survival curves. It is designed to be simple and intuitive and is inspired from MatSurv.

Features
- Generate Kaplan-Meier (KM) survival curves
- Calculate hazard ratios (HR) with 95% confidence intervals using Cox PH method
- Option to show or hide confidence intervals (CI) for KM curves
- Flexible plotting with customizable styles, colors, and labels
- Generate synthetic time-to-event data by specifying hazard ratio and censoring rate.
Installation
You can install PySurv via PyPI:
pip install pysurv
Usage
Here’s a detailed example of how to use PySurv for generating data, plotting KM curves, and customizing the output:
import pysurv

# Generate synthetic data
data = pysurv.generate_time_to_event_data(n_samples=2000, hazard_ratio=0.5, censoring_rate=0.3)

# Plot Kaplan-Meier curve with custom labels and colors
pysurv.plot_km_curve(
    data,
    time_col='time',
    event_col='event',
    group_col='group',
    group_labels=('Control Group', 'Treatment Group'),
    title="Kaplan-Meier Survival Curve",
    y_label="Survival Probability",
    x_label="Time (months)",
    colors=['orange', 'blue'],
    show_ci=True,
    survival_time_points=[12, 24],  # Show % survival at 12 and 24 months
    return_summary=False,
    savepath='./KMCurve.svg'
)
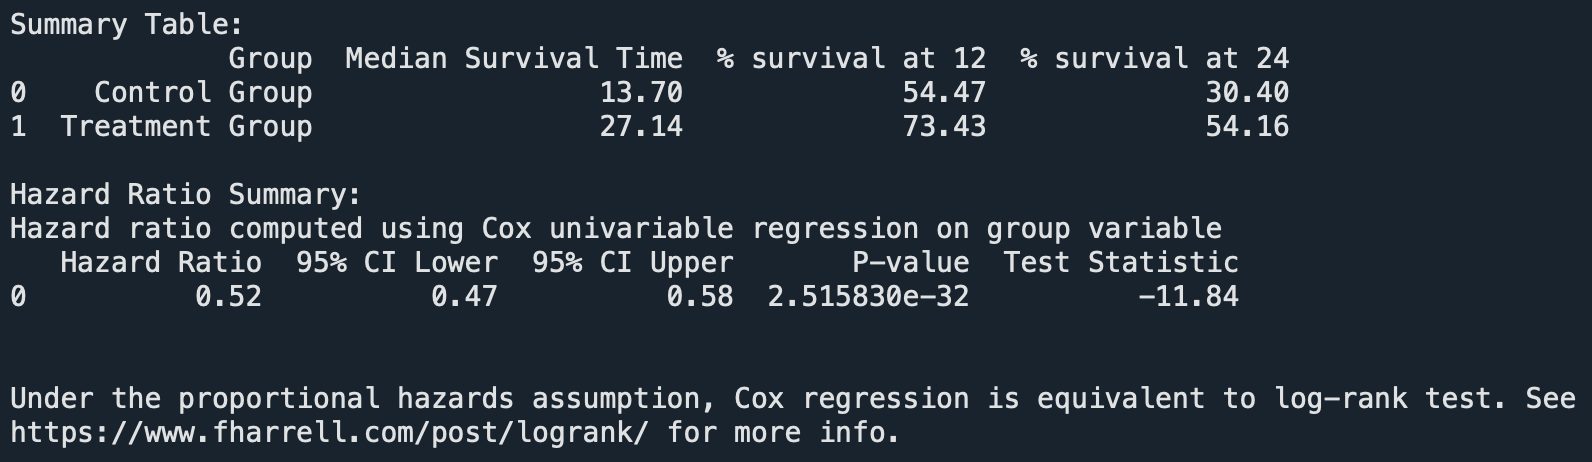
Output:
- A Kaplan-Meier curve
- Summary statistics, including median survival time and percentage survival at given time point(s)
- Hazard ratio and p-value displayed on the plot
Function Reference
plot_km_curve
Plots Kaplan-Meier survival curves and calculates hazard ratios, p-values, and confidence intervals.
Parameters:
- data: A Pandas DataFrame containing time-to-event data.
- time_col: Column name for the time data.
- event_col: Column name for the event data (1 for event, 0 for censored).
- group_col: Column name for the binary group data.
- group_labels: Labels for the groups (default: None).
- title: Title for the plot (default: None).
- y_label: Label for the y-axis (default: ‘Survival Probability’).
- x_label: Label for the x-axis (default: ‘Time (months)’).
- colors: List of colors for the groups (default: [‘r’, ‘b’]). If more than two groups, please manually provide a list of colors.
- line_styles: Line styles for the groups (default: ’-‘).
- fontsize: Font size for text on KM curve including title, axis labels, and risk tables (default: 18).
- linewidth: Line width of KM curves (default: 2.5).
- show_ci: Whether to show confidence intervals on the KM curves (default: False).
- show_inverted_hr: Whether to show inverted hazard ratio (default: False).
- survival_time_points: One or more time point(s) at which to estimate percentage survival (default: None).
- return_summary: Whether to return a summary of survival and hazard ratio statistics (default: False).
- savepath: Complete path (including filename and extension) to save the KM curve plot (default: None).
- **kwargs: Additional matplotlib arguments to pass for plotting KM curves.
*Note:
- PySurv uses a univariable Cox regression model on the ‘group_col’ variable to compute hazard ratios and p-values.
- MatSurv deafaults to the ‘Mantel-Haenszel’ (MH) and ‘log rank’ method.
- Under the proportional hazards assumption, Cox regression is equivalent, if not better, to the MH/log-rank method.
- For more information, see this and this.
Maintained by
- Pushkar Mutha
- Email: pmutha@emory.edu
- LinkedIn: https://www.linkedin.com/in/pushkar-mutha/
If you would like to request a new feature, please feel free to raise an issue on GitHub or reach out via email. If you found this code useful, you can support by leaving a star.